Custom KPIs with gantt subtype
Since v 0.6 RybaFish Charts supports custom KPI metrics with subtype gantt.
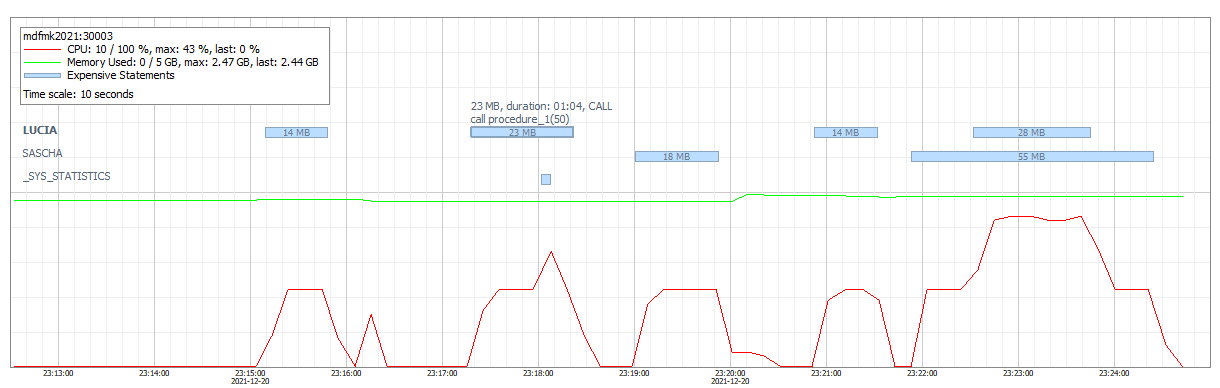
This means if there is a process with the start and stop times - it can be displayed. For example (expensive) statements, delta merges, savepoints, etc.
Can also be some business related data if the sql available: data load times, transformation stages, whatever.
Step-by-step guide for delta merges gantt chart:
Expensive statements explained
file: sql/gantt/01_exp_st.yaml
kpis: [
    {'type': 'service',
        subtype: 'gantt',
        name: 'exp_st',
        color: '#BDF',
        width: 8,
        shift: 2,
        nofilter: False,
        #title: False, # v.09
        #titleFontSize: 6 # v.09
        #gradient: False, # v.09
        #gradientTo: '#FDF', # v.09
        y_range: [60, 100],
        label: 'Expensive Statements',
        description: 'Expensive Statements'}
    ]

sql: >
    select
        host,
        port,
        start_time "START",
        add_seconds(start_time, duration_microsec/1000000) "STOP",
        db_user || '/' || app_user entity,
        -- memory_size gradient, -- uncomment for GRADIENT: True
        -- to_varchar(to_int(memory_size/1024/1024/1024)) || ' GB' title, -- uncomment for Title: True
        to_varchar(to_integer(memory_size/1024/1024/1024)) || ' GB, ' || to_integer(duration_microsec/1000000) || ' sec, ' || operation || ': '
        || to_varchar(start_time, 'HH24:MI:SS.FF3') || ' - ' || to_varchar(add_seconds(start_time, duration_microsec/1000000), 'HH24:MI:SS.FF3') || '\n'
        || REPLACE_REGEXPR('[\n|\r]' in substr(statement_string, 0, 128) with '  ' OCCURRENCE ALL) details
        from m_expensive_statements
    order by start_time desc
Gantt KPIs defined one per yaml file.
YAML file structure
kpis
Mandatory field with list of KPI descriptions. In case of gantt - just one KPI allowed.
type
Can only have one of two values: ‘service’ or ‘host’. When sql provides service-level metric - port must be one of the returned columns.
subtype
Must be ‘gantt’. The other possible subtype ‘multiline’, but this is completely different story.
name
KPI name: will be used internally, must be unique.
color
KPI style color in form of #RGB. #F00 - red, #0FF - cyan, etc.
width
Bar width.
shift
Y-shift in case of overlapping events for the same entity.
title (v.09)
By default this option is off but sometimes it is benefitial to put some text right on the bar itself. In this case set title: True, and in this case you need to provide values for the title of each gantt bar in the title column (not used in the examble above).
titleFontSize (v.09)
Size of the titles font: value of the gantt entry provided in the “TITLE” column when the KPI option ‘title’ is true. You must adjust the gantt width manually to match the font size and vice versa.
gradient (v.09)
When this option set to True, the “GRADIENT” column will be selected from the SQL source. This column defines color inside the gradient of the current gantt entry. For the expensove statements KPI typical GRADIENT definition is column memory_size.
gradientTo (v.09)
gradientTo: ‘#F00’
Color in #RGB format of the second part of the gradient (first part taken from the color option itself, #BDF in this case). Depending on the “GRADIENT” column value, color of the gantt bar will be assignef from color to gradientTo value. Entries having minimum “GRADIENT” value will have color of color propertie (#BDF), max entries will have gradientTo, the rest will have something in between.
nofilter
You can set it to True for KPIs that do not have host/port assigned. For example something from business tables like jobs or similar. In this case no filters on host/port will be applied so the underlying SQL does not have to fake those values. Note: this value applied to the whole sql sorce based on single KPI description, so this setting has to be consistent. In case of gantt chart only one KPI can be defined anyway. This option only testes for the Gantt type so far.
y_range
Pair of values defining the Y range (percentage) for the chart to be drawn, useful in case of several gantt charts.
label
KPI Name in KPI table and legend.
description
Free form KPI description for the KPI table.
sql
SQL statement has to provide HOST, START, STOP, ENTITY and DETAILS columns. Column names are case-sensitive and must be uppercase.
In case of service type also PORT must be provided.
Note: according to YAML formatting rules the sql statement has to start with ‘>’ character and must be idented. Only spaces allowed as indentation character, do not use \t to avoid yaml parsing issues.
START and STOP columns are timestamp format.
ENTITY: this column will be used to group events.
DETAILS: column providing additional information to be displayed when the entry is clicked on.
All of those are mandatory columns.
Manual Color management
This feature available since 096 beta II.
Sometimes you may need to assign specific colors to entries in the Gantt chart based on certain criteria. For instance, highlighting failed ABAP jobs in red for better visibility of KPIs would be beneficial. This is where the manual_color feature comes in handy. Enabling this feature requires setting it to True, along with providing a “color” column in #RGB form. For a practical demonstration, refer to the 12_abap_jobs.yaml file in recent builds.
placeholders
$duration (v 0.9)
It will be replaced by duration string in human readable format.