The best SAP HANA monitoring tool: RybaFish Charts
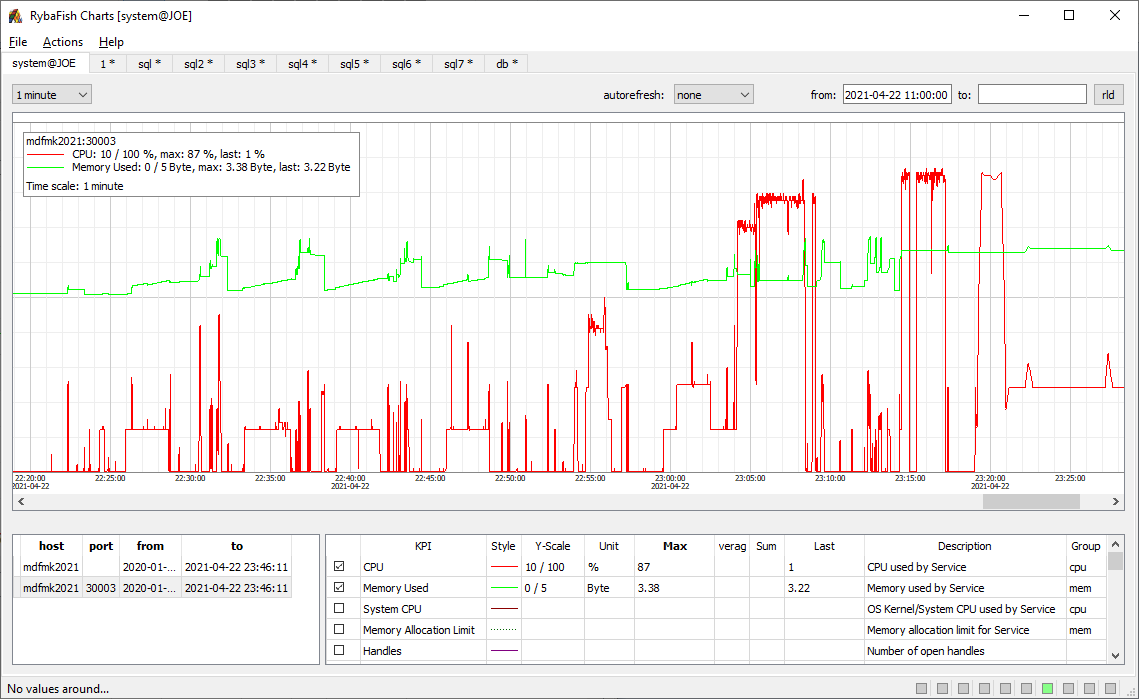
RybaFish Charts is a stand-alone cross-platform application for SAP HANA monitoring. It provides HANA Performance Load Graph functionality. RybaFish is an open source software not affiliated with SAP. For more details please check the about page and planned features list.
No agents, no installation hassle — unzip, launch, and go: instant clarity on SAP HANA performance.
Created by professionals for professionals.
Key Features
- Online performance load charts with scale-out and multi-tenant support.
- Powerful and flexible SQL Console.
- Custom KPIs support: put your own data on the chart!
- Gantt KPIs: whatever having start and stop times - can be put on the chart.
Check out the introduction video:
Download
No installation required, just unzip wherever you intend to run it.
Windows 10
095 Ishkhan last major build, 12.08.2023 (changes).
Windows 7
0.6 EVH works on old windows versions. Try this build if you have “missing api-ms-win-core-path-l1-1-0.dll” error, there is an issue for this.
macOS
095 Ishkhan 12.08.2023, Build on M1 with Rosetta.
091 beta IV runs on Intel/ARM.
Most recent betas for macOS here.
Linux
Work in progress: let me know if you can test a build, I will provide it.
Support
RybaFish is not SAP software, no support from SAP is provided in any form. To report/view known bugs check the project’s issues page.
License
RybaFish Charts is free open source software released under GPLv3 license. The software provided “as is” without warranty of any kind, you can use it at your own risk.
Questions? Suggestions?
Report an issue or suggest a feature here, or just email me at [email protected]